Every metric in the cockpit. Each with its source.
From the first shot to the referee report: everything the cockpit calculates today, in nine areas. Every number shows where it comes from and how reliable it is, and every one is a click away from the matching clip.
- Tags
- from manual or live tagging, included in every setup
- Detection
- needs the pipeline from the broadcast or arena camera
- League data
- from the official swiss unihockey data
Chances and shots · 14
Which chances did you really have?
The score says little about a game. Chance quality says a lot. mxG is calibrated on floorball chances, not borrowed from ice hockey, and every number opens the matching scenes.
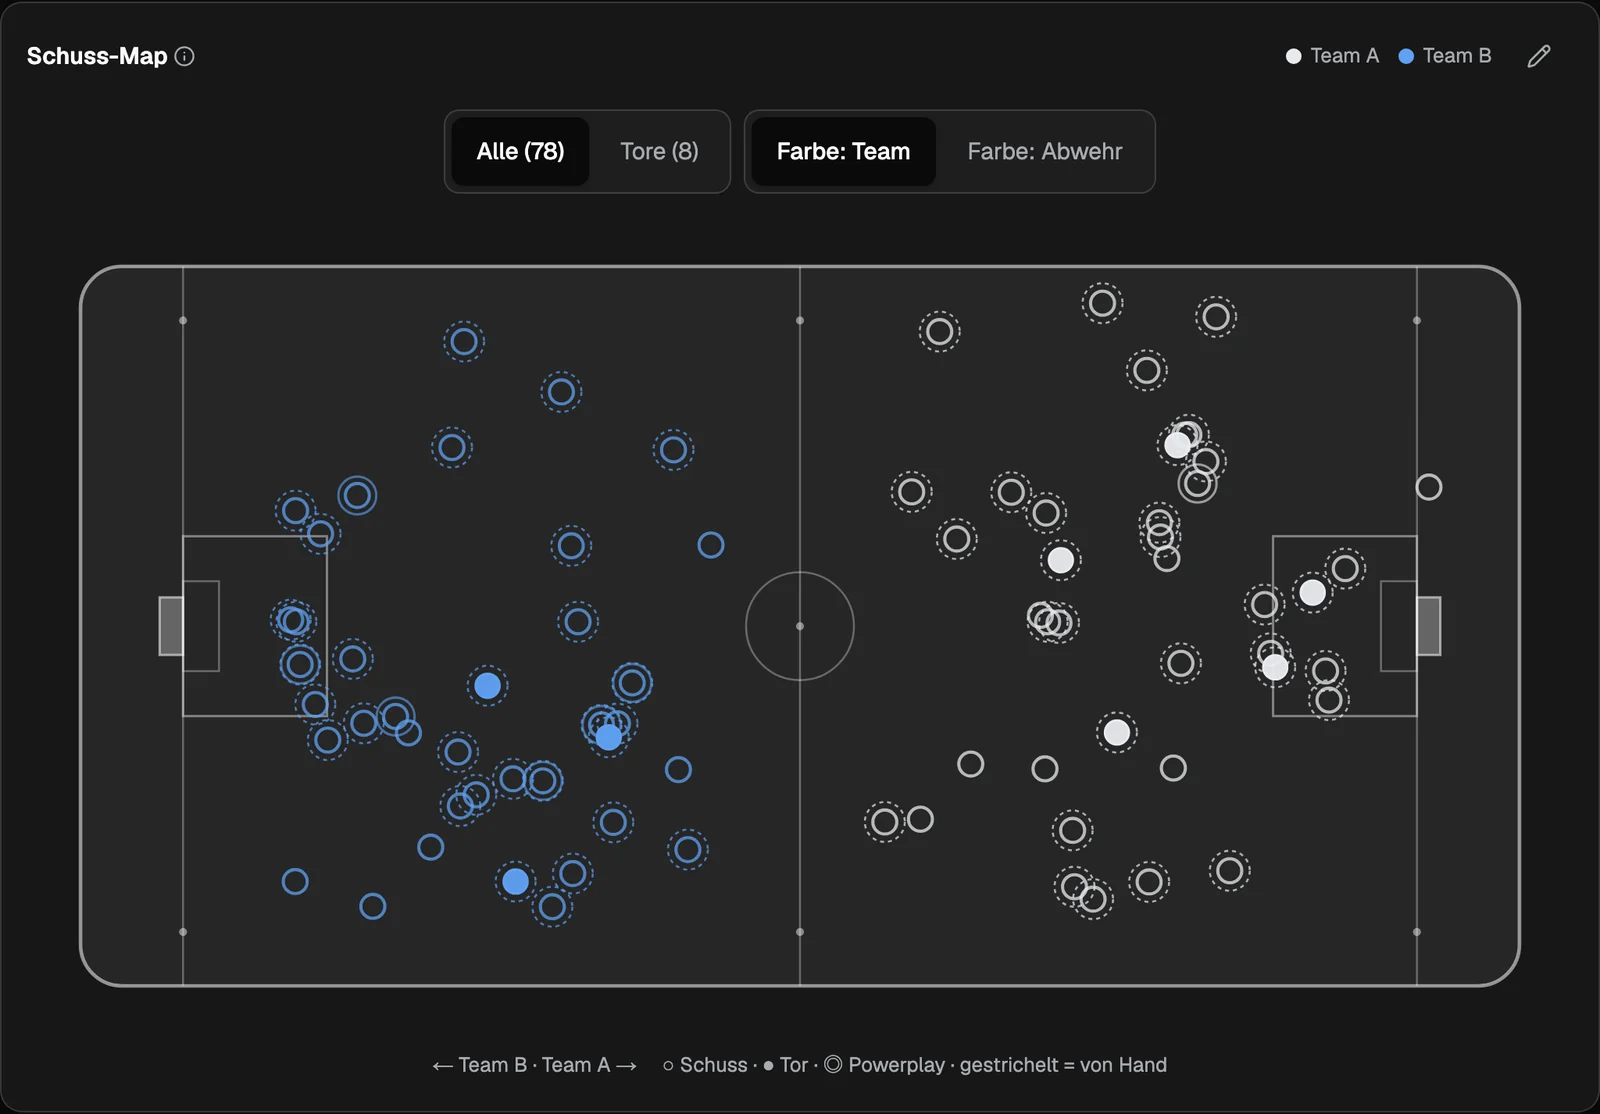
Goals, shots, chances
Every shot with its location, per team, period, line and player.
StandardTagsShot outcome
On target, wide, blocked, for both teams.
StandardTagsmxG (expected goals)
Probability that a shot becomes a goal, summed per game.
StandardTagsmxG 5 on 5 and power play
Chance quality split by game state, net of penalties.
StandardTagsHigh-danger chances
Shots from the most dangerous zones, as count and share.
StandardTagsChances by quality
Every chance graded top, high, medium and low.
StandardTagsSlot shots and average distance
How close a team gets to the goal.
StandardTagsFinishing
Goals minus mxG: who converts above or below expectation.
StandardTagsSecond chances
Rebounds right after a shot, with the goals they produce.
With detectionDetectionShot map
Every shot as a dot on the rink, sized by mxG, filterable by goal and team.
StandardTagsChances by tactical situation
Counter, build-up, set play, standard, forecheck, power play: goals and mxG for each.
StandardTagsHow were the goals scored?
Every goal classified by how it came about, for both teams.
StandardTagsDefence at the shot
Was the defence organised at the moment of the shot?
With detectionDetectionPass before the shot
The last pass before the chance as an arrow, by pass type.
StandardTags
Game control and flow · 8
Who controlled the game?
Over 60 minutes and in every phase: who had the shots, when the game turned and whether the result was deserved.
Corsi
Share of all shot attempts, including blocked ones.
StandardTagsFenwick
Share of unblocked shot attempts.
StandardTagsPDO
Shooting % plus save %: shows how much luck is in the result.
StandardTagsxG momentum
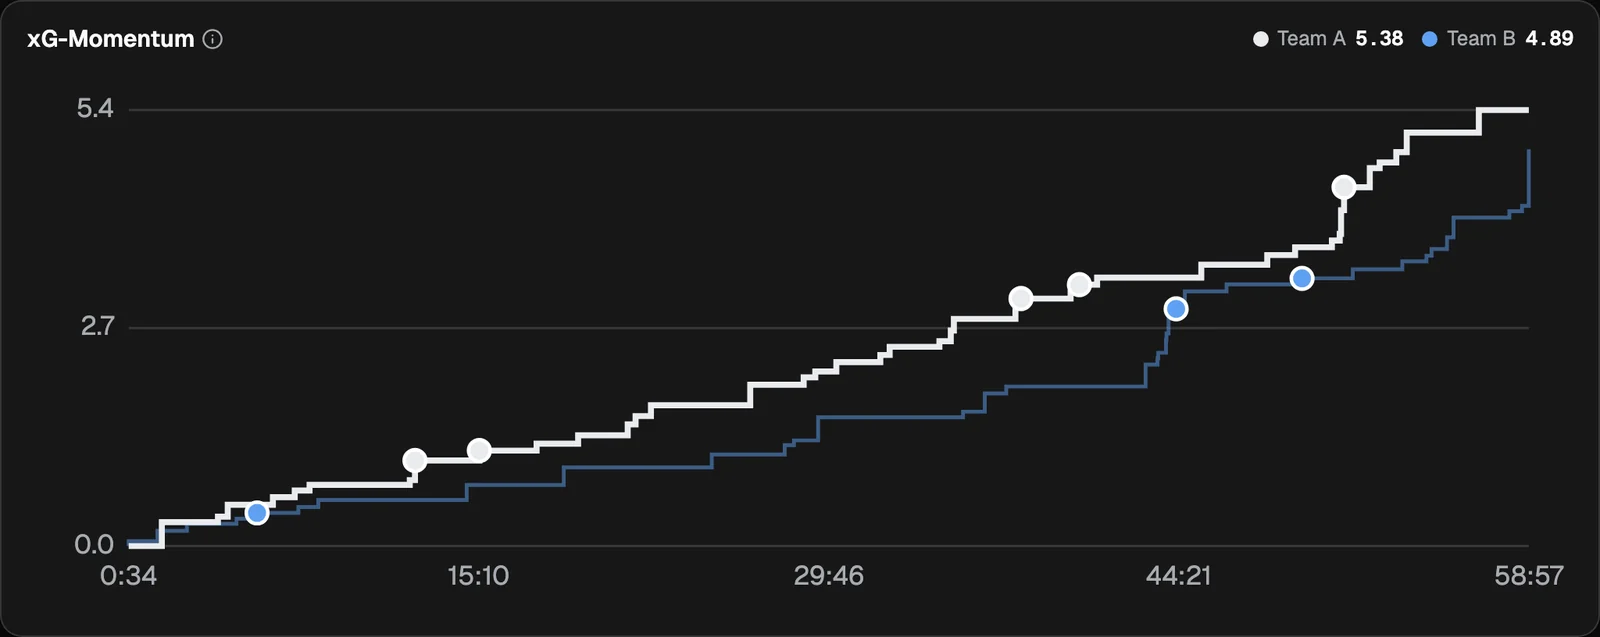
Cumulative chance quality of both teams over time, goals marked, a click jumps to the video.
StandardTagsWin probability
Chance of winning from score and time left, as a curve over the game.
StandardTagsDeserved by chances
How often this game is won with these chances, calculated exactly.
StandardTagsPossession
Share of time on the ball, from positions.
With detectionDetectionAttack time
Time on the ball in the offensive zone.
With detectionDetection
Goalies · 4
Did the goalie keep you in the game?
Save percentage alone says little. What matters is how hard the shots were.

GSAx
Goals saved above expected, relative to chance quality.
StandardTagsSave percentage
Share of shots on target that were saved.
StandardTagsGoals against and mxG against
Per game and across the season, with every goal against as a clip.
StandardTagsGoalies across the season
GSAx and save percentage per goalie over all games.
StandardTags
Transition and counters · 8
How do you move the ball forward?
Zone entries, counters and turnovers: where possession turns into danger and where it gets lost.
Zone entries
How often a team enters the offensive zone with control.
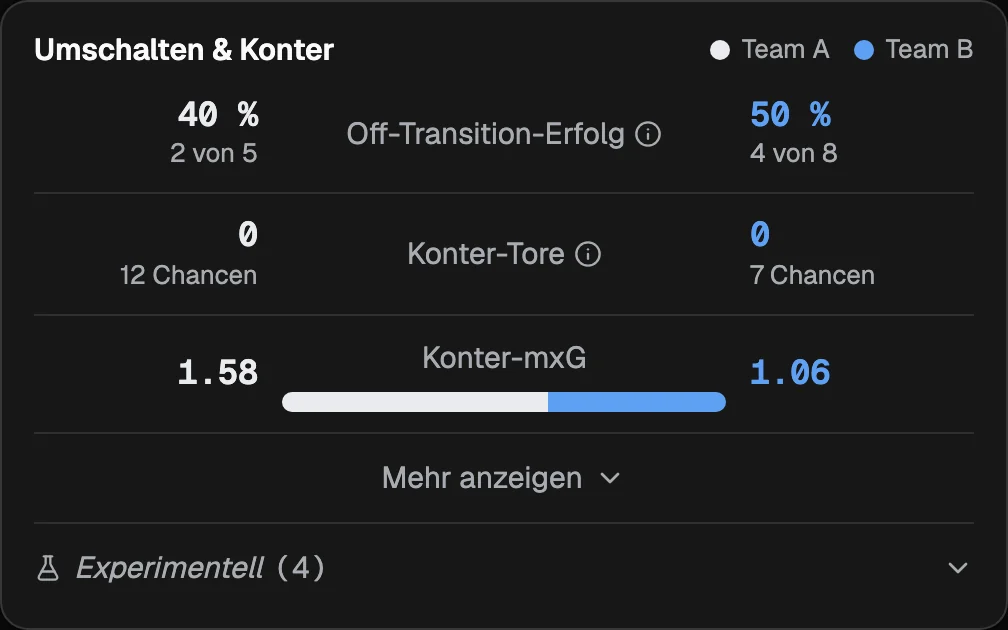
StandardTagsEntry success rate
Does the team keep the ball for at least three seconds after the entry?
With detectionDetectionEntry value
Chance rate, mxG per entry and goals within 15 seconds, also per line.
StandardTagsCounter goals and counter mxG
What comes out of fast transitions.
StandardTagsOffensive transition success
Share of successful transitions after winning the ball.
With detectionDetectionRecoveries → chance
Map of ball recoveries, linked to the chances that follow.
With detectionDetectionTransition speed and rush share
How fast and how often a team attacks straight after winning the ball.
ExperimentalDetectionTurnovers and turnover cost
Where the ball is lost and what it costs.
ExperimentalDetection
Passes, space and xThreat · 12
Where does the danger come from?
From the positions of all players and the ball: which passes open the game and which space matters.
Pass completions
Completed passes per team.
With detectionDetectionCentral, forward and long passes
Which passes move the game forward.
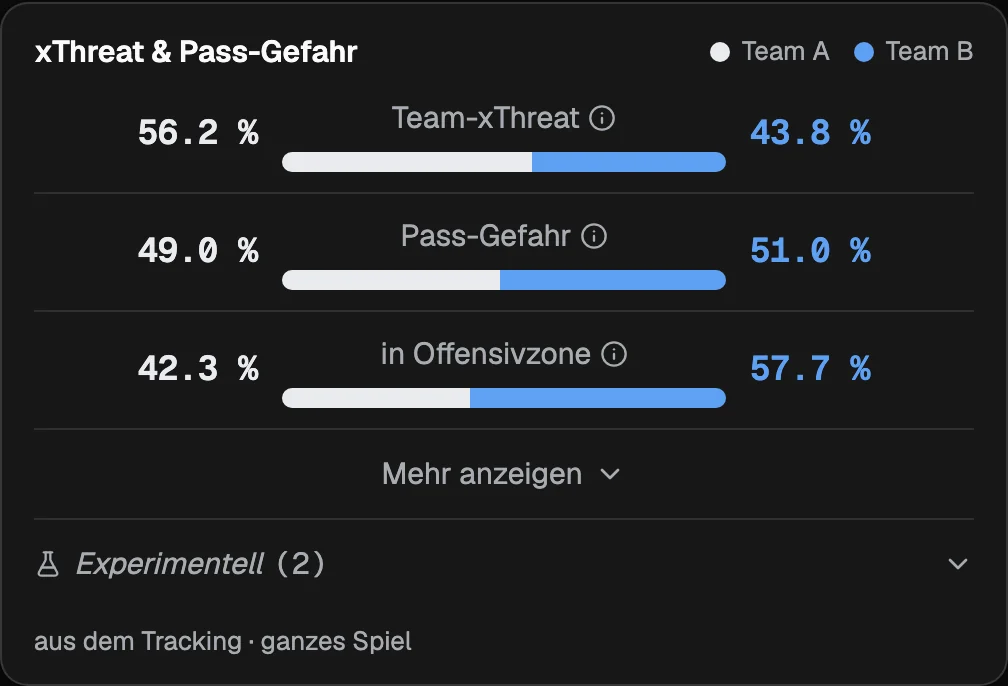
With detectionDetectionxThreat
How much goal threat each action creates, from a danger map of the rink.
With detectionDetectionxThreat momentum
Cumulative pass threat over time.
With detectionDetectionPass danger
Danger of passes, split into offensive and neutral zone.
With detectionDetectionDangerous space
Who occupies the space in front of the goal, corrected for camera effects.
With detectionDetectionNeutral-zone control
Who owns the middle of the rink, corrected for camera effects.
With detectionDetectionTerritory
Space control as a map of the whole rink.
With detectionDetectionBuild-up before chances
Ball paths in the last seconds before every chance.
With detectionDetectionBall distribution by third
Where the game is played.
With detectionDetectionCarry threat, cross passes, passes under pressure
Danger from carries and from passes under pressure.
ExperimentalDetectionCompactness, line height, width, depth
How a team stands as a block.
ExperimentalDetection
Pressing and forechecking · 3
How good is your pressure?
Pressure after losing the ball often makes the difference in floorball. We count it and show whether it works.
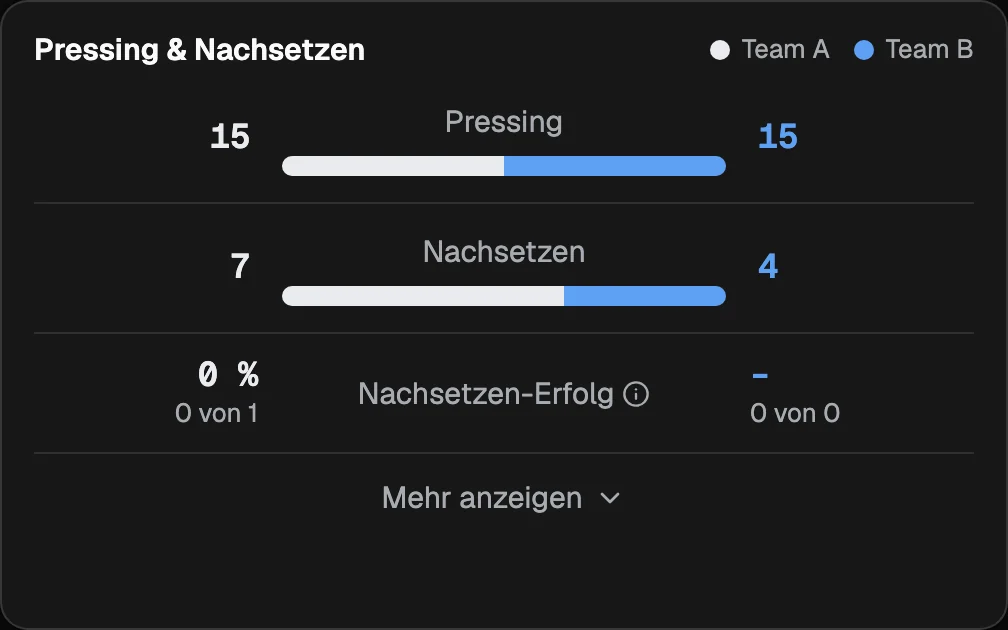
Pressing
Number of pressing situations per team.
StandardTagsForechecking
Pressure right after losing the ball, tagged or suggested by the detector.
With detectionDetectionForechecking success
Successful, unsuccessful or unclear, as a rate.
With detectionDetection
Lines and players · 8
Which line is working?
Who is on the floor when, with whom and against whom, and what happens in that time.
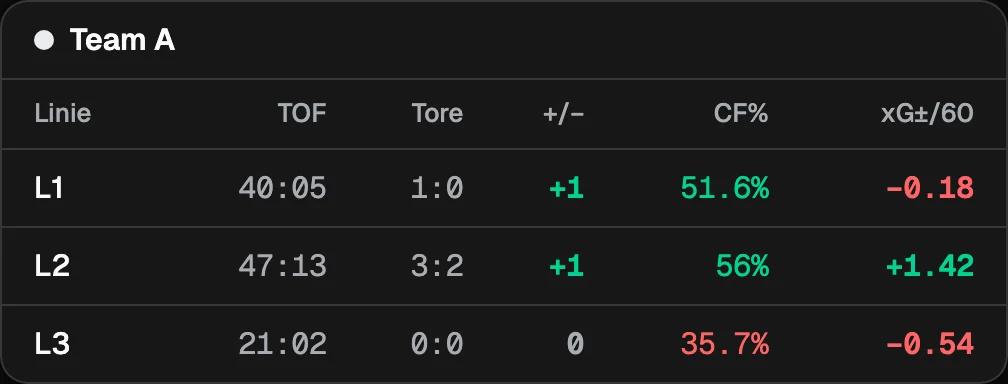
Time on floor and shifts
Ice time per player and line, number and length of shifts.
With detectionDetectionLine statistics
Goals, Corsi, xG for and against, xG balance and xA per line, also per 60 minutes.
With detectionDetectionLine match-ups
Which of your lines played how long against which opposing line.
With detectionDetectionSpecial units
Power-play and box-play units with time, shots, xG and goals.
StandardTagsPlayer table
Goals, shots, mxG, CF%, xGF%, relative values and plus-minus per player.
With detectionDetectionPlayer profile
Radar against the pool, shot map, line mates, trend across the season.
With detectionDetectionPlayer pairs (WOWY)
How players perform with and without each other.
With detectionDetectionWin points
How much a player's goals changed the win probability.
StandardLeague data
Special situations and discipline · 5
What do power play and box play bring?
Power play and box play decide close games. We show time, chances and goals in every situation.
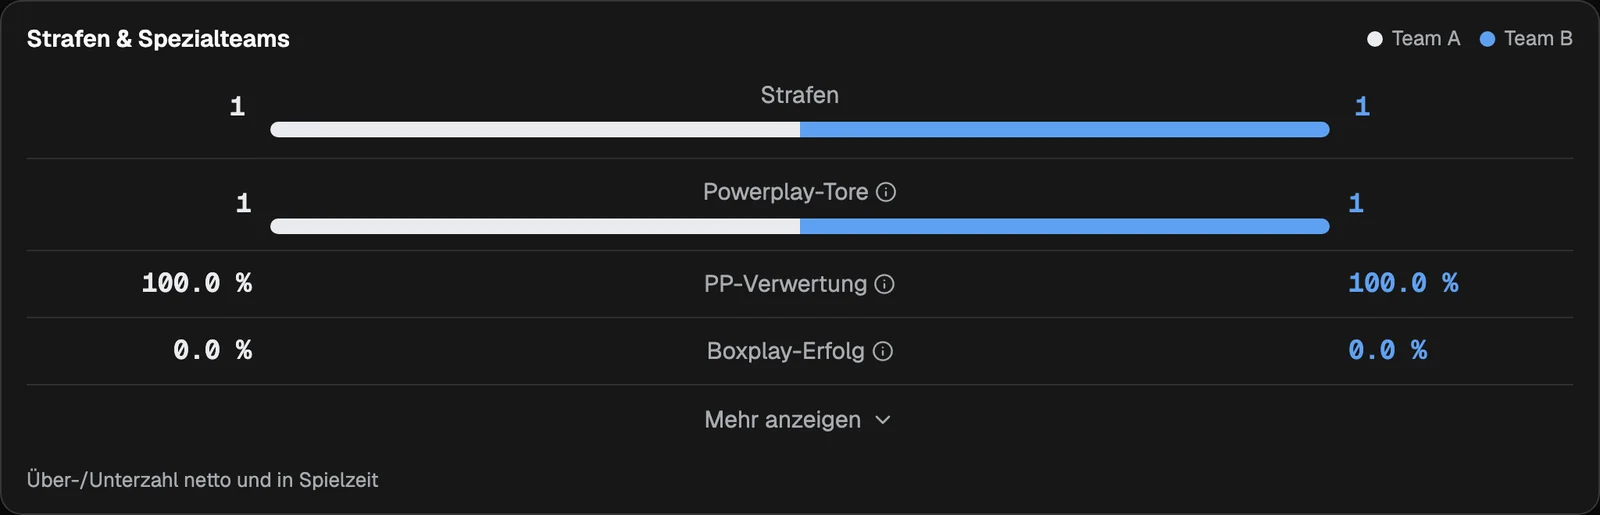
Penalties and penalty minutes
Per game, by type and timing.
StandardLeague dataPower-play conversion
Goals per power play, with time, shots and entries.
StandardTagsBox-play success
Penalties killed, goals against and xG against.
StandardTagsGoals and xG by situation
Power play and box play, each with time, goals for and against, and xG.
StandardTagsFormation on power play and box play
Width, compactness and depth of the set-up.
ExperimentalDetection
Season, opponents and league · 8
Where do you stand in the season?
From a single game to the season and the next opponent, set against the whole league.
Season trend
Cumulative goals and xG, your team against its opponents.
StandardTagsBy period and score-adjusted
How a team plays depending on period and score.
StandardTagsBy opponent strength
Performance against strong, medium and weak opponents.
StandardTagsOpponent dossier
Strength, forecast, form, head-to-head and a traffic light for strengths and weaknesses.
StandardLeague dataLeague trends
Goals per game, power-play and box-play rates across the season.
StandardLeague dataTime-out efficiency
Goals for and against in the five minutes after a time-out.
StandardLeague dataReferee report
Penalties per game and home-win rate per referee.
StandardLeague dataSchedule density
How rest days affect results.
StandardLeague data
Every number becomes a clip.
Game report as PDF
The game in numbers, shot map, lines and key findings on a few pages.
Similar scenes
Finds comparable plays in other games, from positions alone.
Live tagger with mxG
Tap shots at the bench, see mxG live, linked to the video later.
Presenter
Clip lists, drawing on video and share links for the team meeting.
Not in the catalogue because measured several times without a reliable signal: shot outcome from video (on target, wide, blocked stays manual), running distance per player, odd-man rushes from positions, tactical formation judgements. We would rather say so than promise it.
Which metric are you missing?
Tell us which league you play in and what video you have. We reply within two days.